ACE affiliate Deltek found out how Architecture and Engineering firms across the world measure performance. Explore the findings, and the key metrics used, below.
The Deltek Clarity Architecture and Engineering (A&E) study has been assessing the state of the industry in North America for over 40 years. Now, we’ve extended the into the European and APAC regions.
We asked firms about how they performed throughout the 2019 fiscal year. Then, we asked them what KPI’s they use to stay on target and track improvement.
So, what are the key metrics used to measure success in the A&E industry? How do different regions compare? And what are the top barriers and facilitators to meeting these KPIs?
How does your firm compare?
We asked firms from APAC and European markets five questions to benchmark their performance:
- What percentage of projects were on/under budget?
- What percentage of project were delivered on/ahead of schedule?
- What was your average utilisation rate?
- What was your average overhead rate?
- What was your employee turnover rate?
In the key areas of the report, the different regions were fairly consistent in their responses. For other questions though, we see significant differences.
For example, average utilisation rates across EMEA and APAC are similar, while in the Nordic region, firms report themselves as having higher rates. None of the organisations surveyed in Denmark, Sweden and Norway reported a utilisation rate below 20%, and Danish firms stated the highest overall, with 65% of firms having a utilisation rate between 61 and 100%.
Average overhead rates, however, see greater variety across regions and countries. We asked firms to calculate their total overhead divided by total direct labour expense. While 70% firms in APAC report rates of 91-120, only 40% of European and Nordic regions say the same. The majority of New Zealand and Singapore firms (87% and 79% respectively) report rates at this level. Meanwhile, 2% of Nordic firms report rates between 1-60 – the only region to report rates this low. European firms rank the highest, with a third reporting rates of 151-180.
The key to KPIs: only measure what’s important to you
These figures give an overview of how other A&E firms are performing, and how your organisation compares. But while these are useful indicators of overall performance, there are more granular KPIs firms use to track performance in key strategic areas. Every organisation has different goals and processes, so how they measure success is different too.
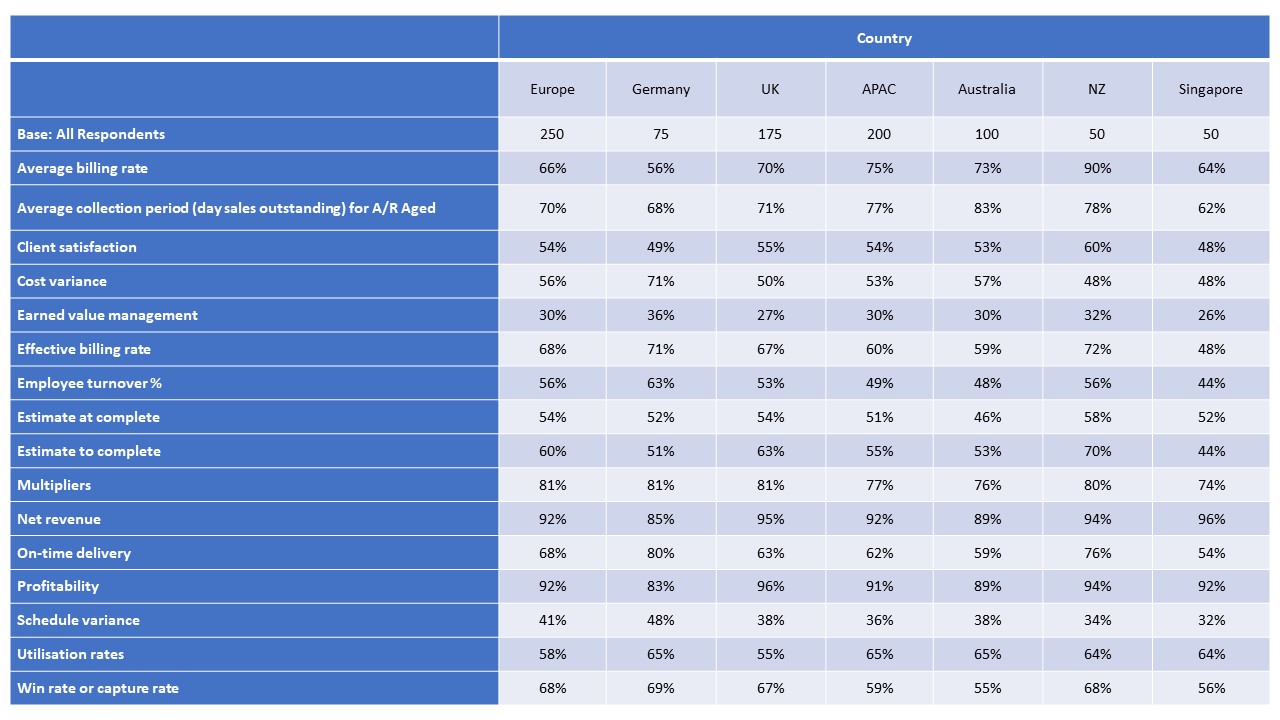
So, we asked respondents what KPIs they measure. And while the list is extensive, there are a few commonalities. Predictably, net revenue and profitability are measured the most, with 92% of firms tracking each. Less expected is the 74% of firms that measure their average collection period.
In comparison, only 54% of organisations globally track client satisfaction. Interestingly though 70% of Danish firms say they track it. And it’s not the only time that they take the lead. Of the KPIs we asked them about, they track an average of 74% - more than any other country.
And just as there are some KPIs tracked frequently, there are some that only a few firms look at. Schedule variance is measured by 36% of firms, while earned value management is looked at by only 33%. Interestingly, a significant proportion of Swedish firms report tracking value management, with 60% measuring it.
These differences between firms and regions only go to show the variety of KPIs tracked around the world. While it’s useful to see the kinds of metrics other businesses are focusing on, the most effective KPIs will always be the ones tied closely to your strategic objectives.
The barriers to success – and the facilitators
Setting up the right KPIs is important. But at some point you have to start improving the numbers you’re tracking. And whether your firm is looking to improve profitability, cost variance or the percentage of employee turnover, there will likely be hurdles – and facilitators – along the way.
Interestingly, collaboration is ranked as a top barrier to meeting KPIs – and a top facilitator. Of the firms we surveyed, 20% say ‘limited cross-functional cooperation’ is the top challenge in meeting their KPIs. Notably, only 14% of Nordic organisations say this is their largest problem – compared to 25% of firms in the APAC region. In contrast, 21% of firms rank ‘ample cross-functional cooperation’ as their top facilitator. A quarter (26%) of firms in the European region put it in the top spot, but only 17% of APAC firms.
The facilitator ranked number one by the most firms overall, however, is ‘strong project monitoring’. A quarter of all firms (24%) globally rank it as their top facilitator, although within the APAC region there is some variation. A third (30%) of New Zealand firms position it as their top facilitator, compared to only 16% of firms in Singapore.
Meanwhile, 17% of firms see ‘informal processes’ as the biggest barrier to meeting KPIs – with 42% ranking it in their top three. Interestingly, more firms in the Nordics (26%) consider this their biggest hurdle than in any other region.
 Click here for a full screen version.
“The results of this new research are fascinating”
Hannah Vickers, chief executive of the Association for Consultancy and Engineering (ACE) said: “The results of this new research are interesting, especially within the context of a shifting industry and changed demands from clients.
International comparators are always useful and demonstrate that there is in fact limited difference in productivity and performance across the world from the consultancy businesses. The question going forwards is how we need to evolve our measures of productivity and performance in a changing digital world – utilisation doesn’t capture productivity gains from technology.
“The collaborative nature of our work means that it is rightly viewed as a key facilitator to success, but the fact that it is also seen as a challenge to achieve this in many instances suggests that we should approach it with care to ensure that all parties benefit from a closer relationship.
“I would encourage business leaders to explore the headline metrics of this research from Deltek.”
Get the full survey findings
With the right metrics, you can identify what’s working, and tailor your strategy to deliver the best results. But first, you need to know what areas to improve.
